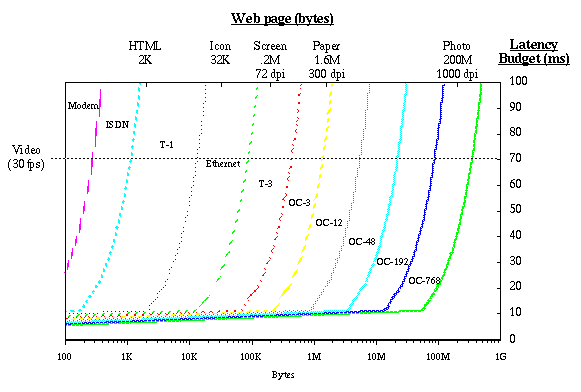
The following graph represents the relationship between bandwidth, file size, and access latency for networked client/server systems. An explaination and legend are below.

The good news
- Interactive HTML requires at least T-1 speeds (1.5 Mbps)
- Interactive HTML with icons requires at least Ethernet speeds (10 Mbps)
- Interactive screen images require at least T-3 speeds (45 Mbps)
- Full-motion screen video requires at least T-3 speeds (45 Mbps)
The bad news
- Cross-country interactive screen images require OC-3 (155 Mbps)
- Interactive paper images require OC-12 (1.2 Gbps) to go past a LAN
- Places more than 85 ms away won’t ever be interactive– E.g., LA to NYC or Boston is too far- Forget interactive transcontinental access
The light at the end of the tunnel
We’re fond of observing that
Everybody talks about the speed-of-light,
but nobody ever does anything about it
We think we have one possible solution, however…

Explaination of the graph
The horizontal axis (X) denotes file size, increasing to the right. It indicates the quality of Web access, going from HTML/ASCII, to HTML with small GIFs (icons), large screen-resolution GIF images (e.g., photos, graphs), etc. The “paper” and “photo” sizes indicate high-resolution images, displayable on custom screens (possibly in the future). Under the top X-axis labels are the approximate file sizes and screen resolutions (for images).
The right-side vertical axis (Y) denotes available latency, decreasing to the bottom. It indicates the latency available for transmission, and does not include propagation latency. Available latency is based on a 100-ms latency budget, the amount of time allowed between a request and response for interactive access (according to human factors research).
The colored “contour” lines indicate the bandwidth required for the response to be received (entirely) in the available latency. For example, HTML web pages can be sent most anywhere in the USA from a US location in a T-1 line (1.5 Mbps), however, screen-resolution images require at least a T-3 line (45 Mbps) to get 3/4 of the way across the US, and an OC-3 (155 Mbps) to get anywhere in the US.
The left-size vertical axis is labelled with the equivalent “latency” for real-time, full-motion (30 fps) video, with varying resolution along the X axis as before. Note that “video” HTML doesn’t mean much, but small icons through photo images can be full-motion.
Legend
- HORIZONTAL – Web page (bytes)
- HTML – simple HTML or ASCII text, about 2K bytes
- Icon – HTML with small icons (logos, etc.), about 32K bytes total
- Screen – one 72 dpi image, 4″ square, 8-24 bits/pixel (.2M bytes)
- Paper – one 300 dpi image, 4″ square, 8-24 bits/pixel (1.6M bytes)
- Photo – one 1000 dpi image, 4″ square, 8-24 bits/pixel (200M bytes)
- VERTICAL – Latecy Budget (ms) / Video
- Latency Budget – time left for file transmission, I.e., 100 ms interactive response time, minus propagation latency
- 100 ms – within a LAN (inside an organization)
- 90 ms – with a MAN (inside a city)
- 50 ms – halfway across the US, or across all Europe
- 10-0 ms – across the US
- -250 – transcontinental, or satellite hop (i.e, no budget left)
- Video – bandwidth required for 30 fps full-motion video
- Latency Budget – time left for file transmission, I.e., 100 ms interactive response time, minus propagation latency
- CONTOUR (colored levels) – Bandwidth required (uncompressed)
- Modem – 28 Kbps
- ISDN – 112 Kbps
- T-1 – 1.5 Mbps
- Ethernet – 10 Mbps (maximum per host, hubbed)
- T-3 – 45 Mbps
- OC-3 – 155 Mbps
- OC-12 – 622 Mbps
- OC-48 – 2.5 Gbps
- OC-192 – 10 Gbps
- OC-768 – 40 Gbps
